Changes in the trading schedule
Please note that on the night of October 25–26, 2025, European countries will switch to winter time.
Investizo LTD. Business company number 25432 BC 2019
Suite 305, Griffith Corporate Centre,
P.O. Box 1510, Beachmont, Kingstown,
St. Vincent and the Grenadines
DUNS 817053497
Phone:+996312610515
E-mail: [email protected]
© 2019-2025 Investizo 18+ Todos los derechos reservados
Advertencia de riesgo: los CFD son productos financieros complejos que se negocian con margen. El comercio de CFD es arriesgado y puede no ser adecuado para todos los inversores. Asegúrese de comprender los riesgos involucrados, ya que puede perder todo su capital invertido.
Please note that on the night of October 25–26, 2025, European countries will switch to winter time.
Please note the changes in the trading schedule due to the Labor Day holiday in the USA.
Please note that there are changes in the trading schedule due to the Independence Day celebrations in the United States.
Today, Investizo celebrates its 6th anniversary — years of growth, achievements, and the support of traders from around the world.
We are pleased to announce that Investizo LTD has been awarded Best ECN Broker Vietnam 2025 by the prestigious International Business Magazine Awards.
We would like to inform you about an adjustment to the opening time of the XAUUSD trading session due to changes from our liquidity provider.
We are excited to announce that Investizo has been awarded the Best Copy Trading Platform South East Asia 2025 by World Business Outlook.
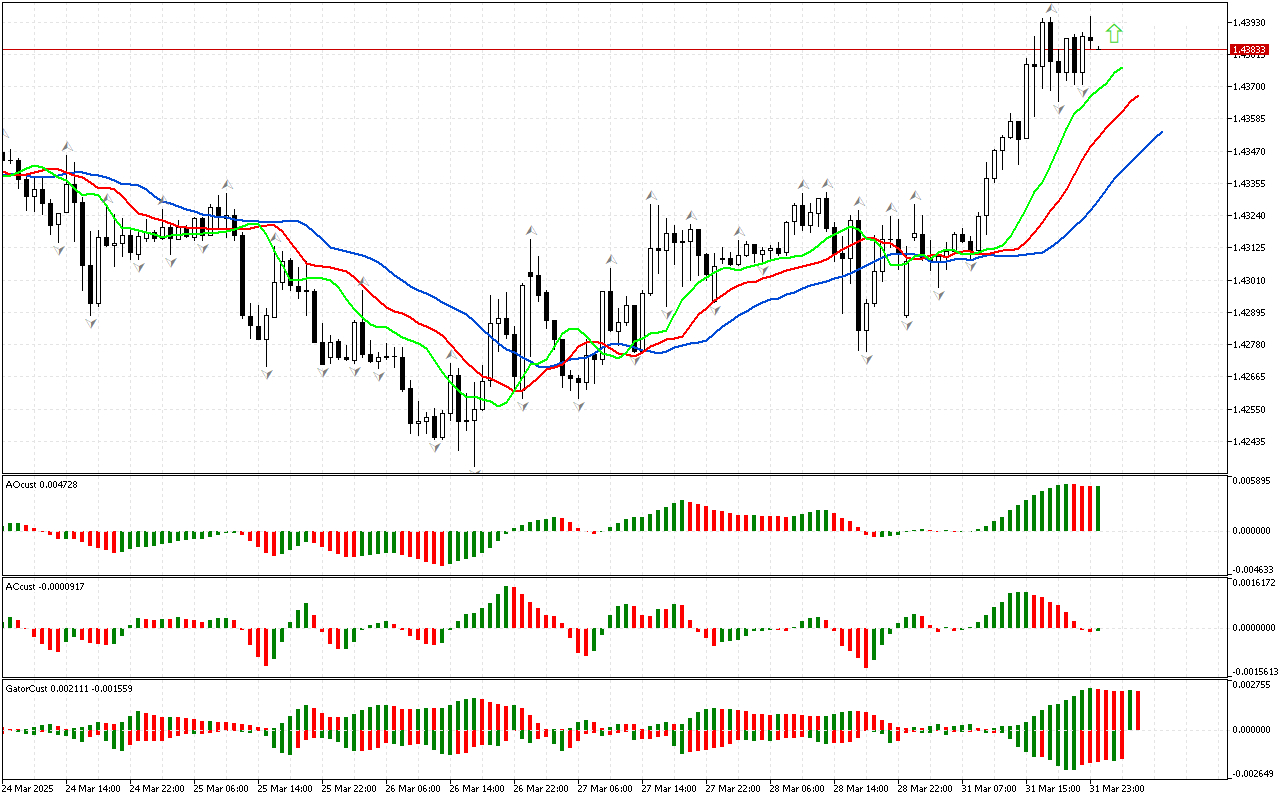
According to USDCAD, the phase space is defined as northern, since the price has risen above the upper fractal. Now we can examine signals from other market dimensions within the...
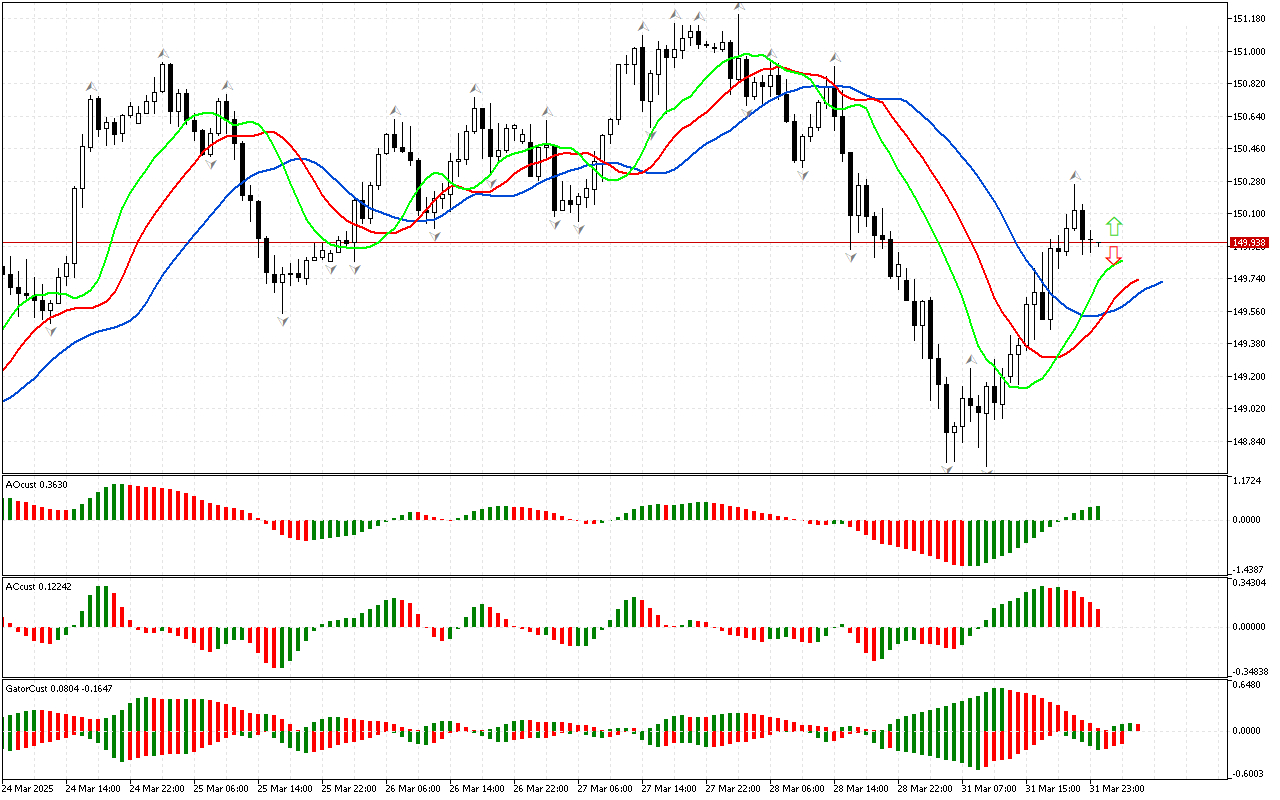
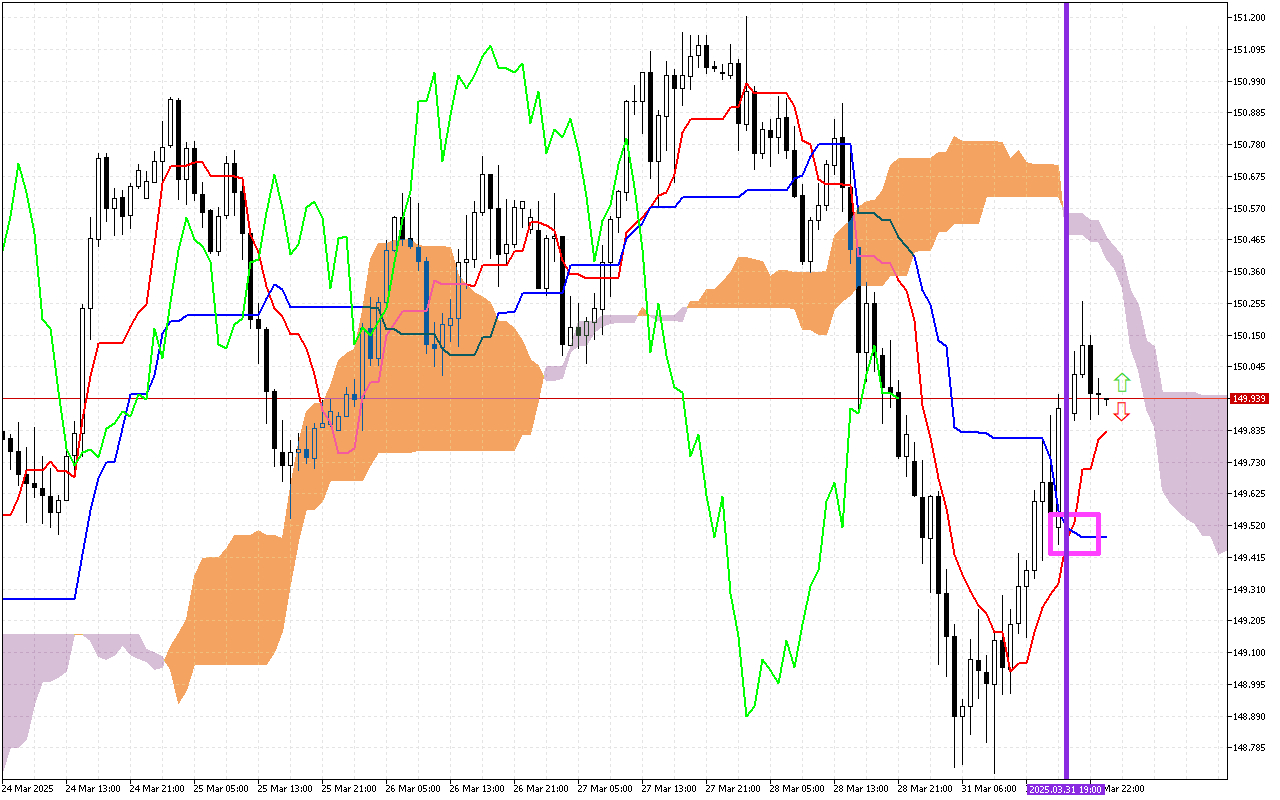
The market situation regarding USDJPY is not defined. The price did not fall below and did not rise above any of the fractals. Therefore, the signals from other indicators should...
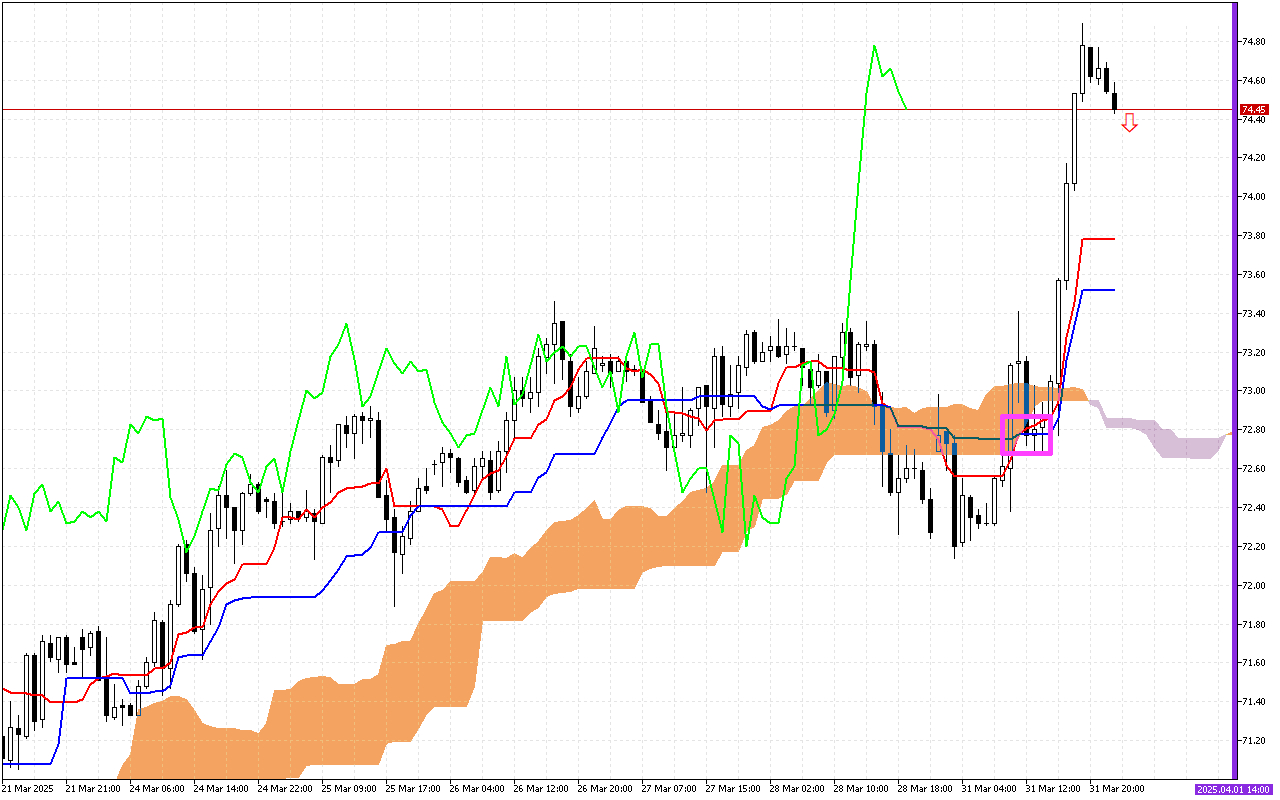
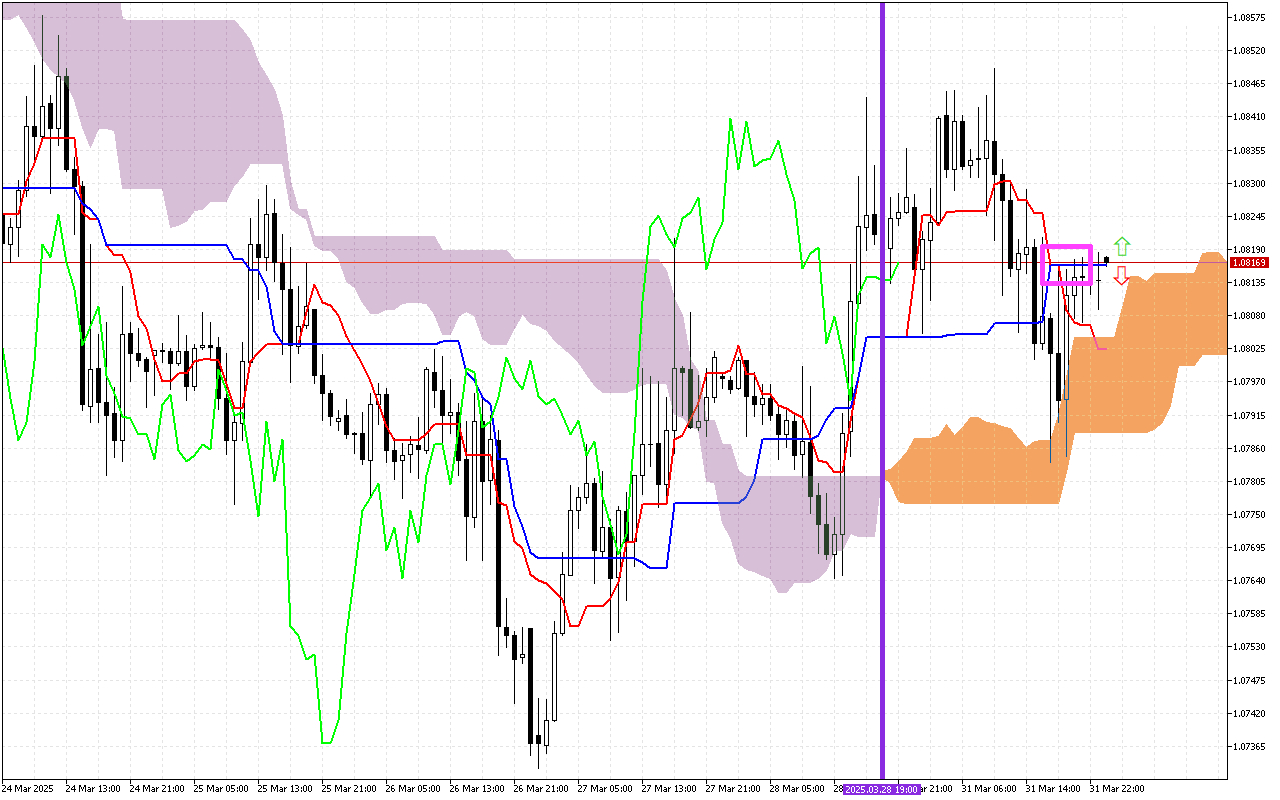
One of the main signals of previous trading sessions was the intersection of the Tenkan and Kijun lines. This area is marked with a pink square on the graph. The...
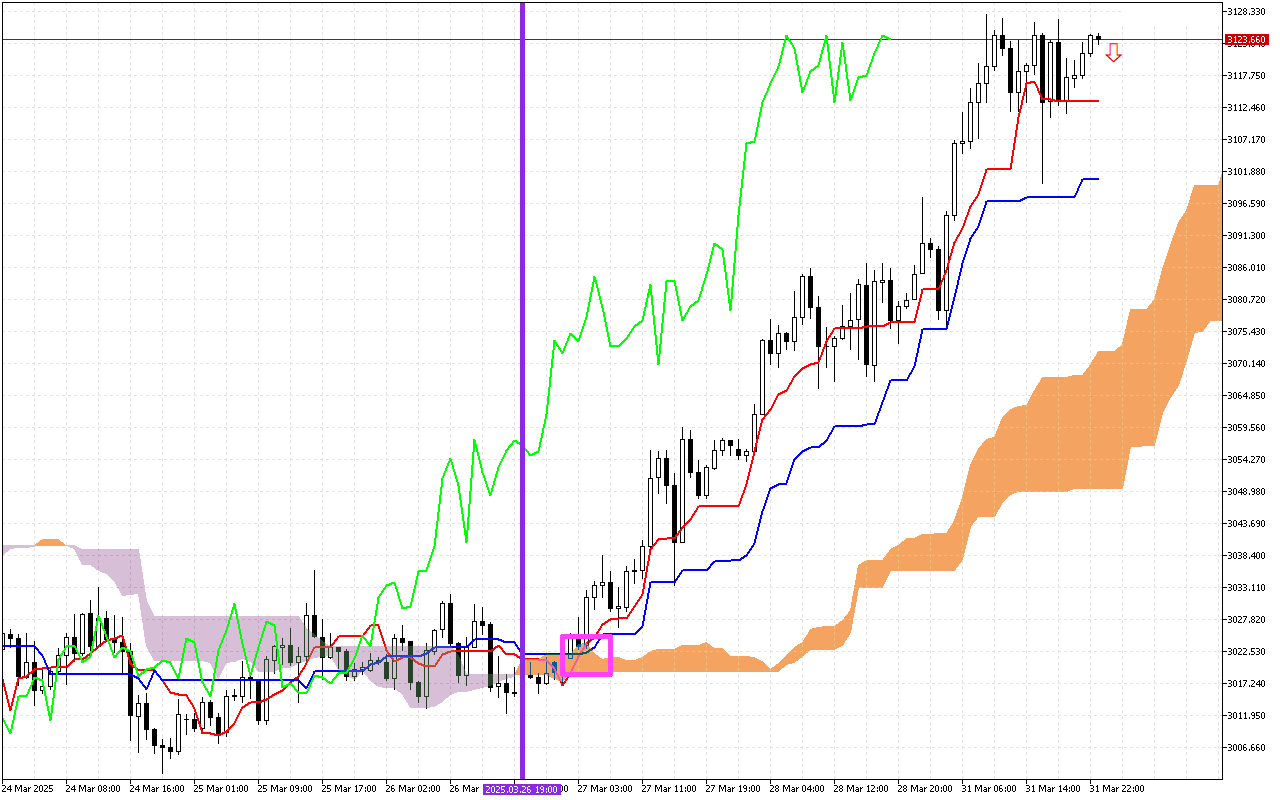
The most significant signal of the previous trading sessions was the intersection of the Tenkan and Kijun lines, which is considered as a signal of a change in trend in...
The most significant signal of the previous trading sessions was the intersection of the Tenkan and Kijun lines, which is considered as a signal of a change in trend in...
The most significant signal of the previous trading sessions was the intersection of the Tenkan and Kijun lines, which is considered as a signal of a change in trend in...
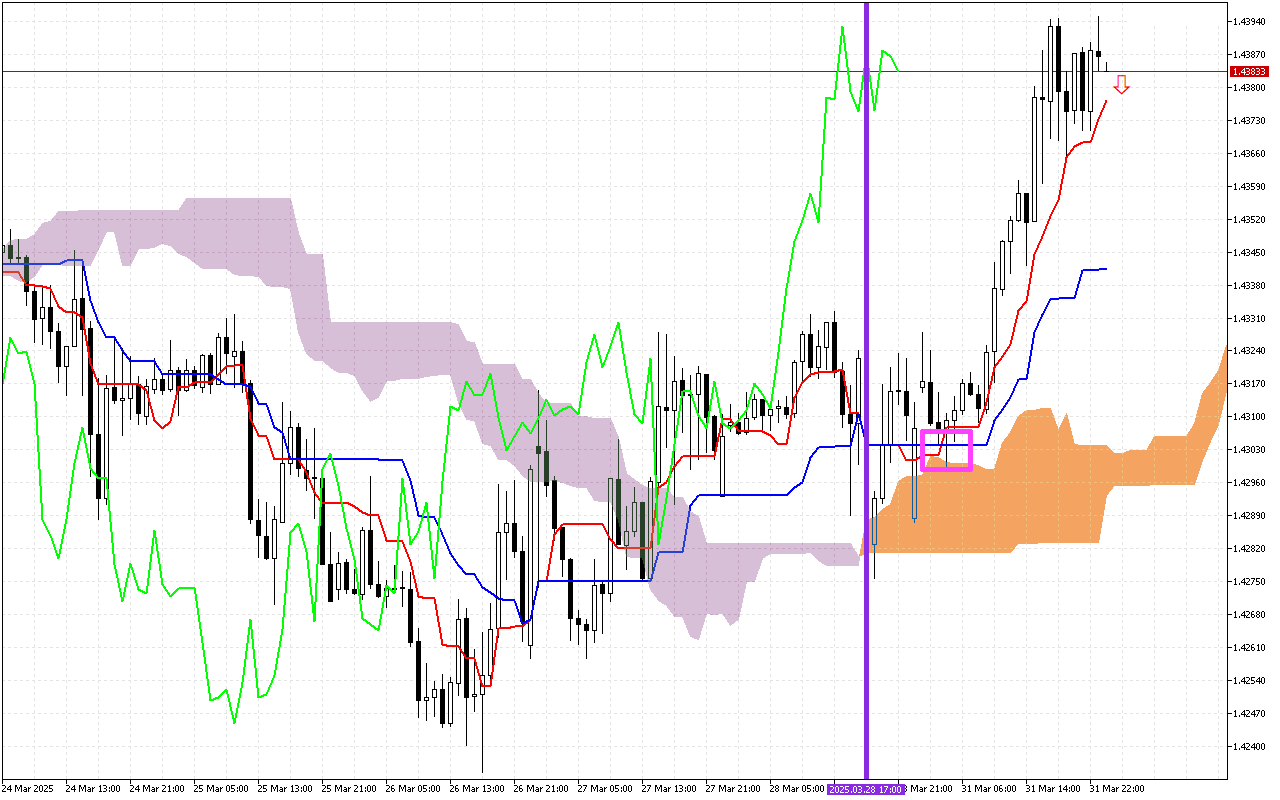
During previous trading sessions, the intersection of the Tenkan and Kijun lines, marked with a pink square, was observed on the GBPUSD chart. This signal indicates a potential change in...
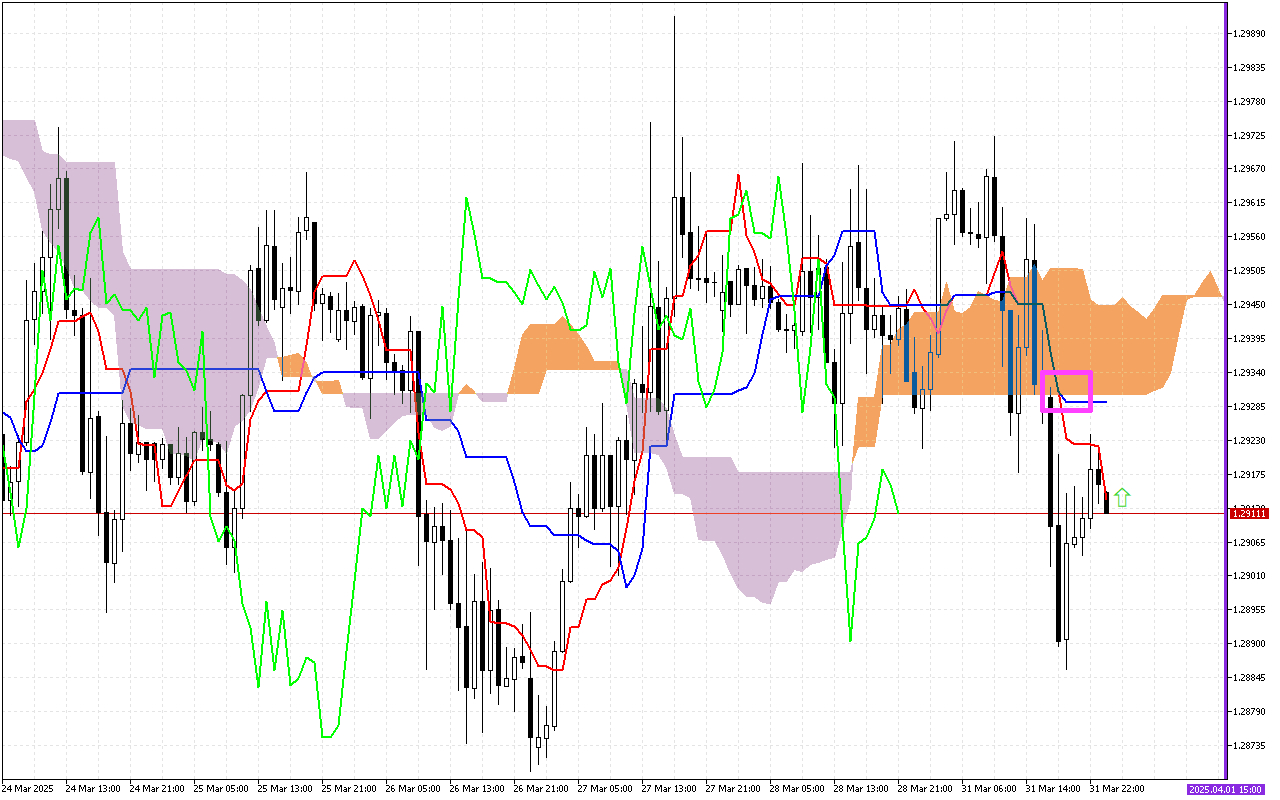
Analyzing previous trading sessions, it is worth paying attention to the intersection of the Tenkan and Kijun lines, marked with a pink square. The fast Tenkan line fell below the...